The Rain Risk Dashboard is designed to allow users to determine the risk of rain and storms for the next six days.
Dashboard Features
-
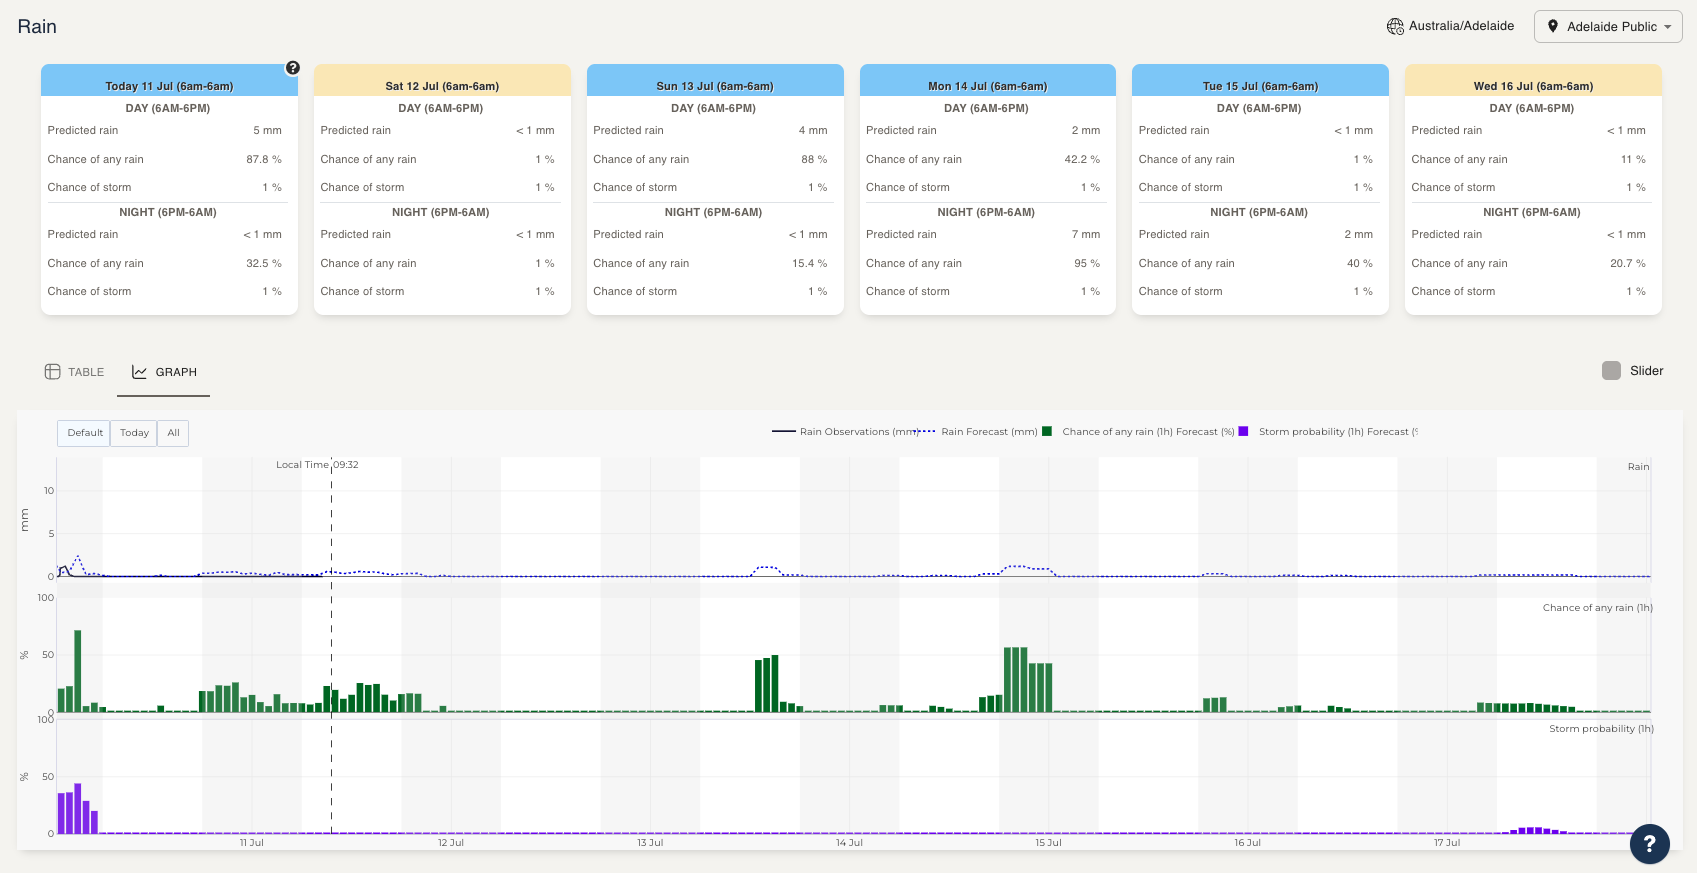
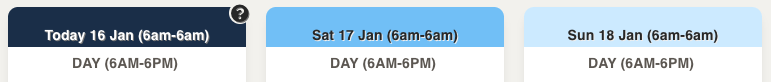
Cards showing daily summaries and colour-identified risk levels for the next 6 days.
-
For sites with a weather station, a summary of historical rain observations is also presented.
-
Detailed hourly data can be seen as a table (select Table tab) or graph (select Graph tab). The tabs are located above the table/graph on the left-hand side.
-
If you have your weather station set up to send data to Kite this is shown in the table in bold and is presented on the graph as a solid line.
-
You can extend the data viewed on the graph by clicking the All button, located on the top left-hand side of the window.
Card Colours
The card colours represent the rain risk levels, which are defined as:
|
Chance of Rain (light blue) |
If the probability of any rain or a thunderstorm is > 1%. |
|
Rain Likely (medium blue) |
If the rain predicted is > 0.1 mm/hr or > 1 mm/day. |
|
Heavy Rain Likely (dark blue) |
If the rain predicted is > 2 mm/hr or > 15 mm/day. |
These are the standard settings. Custom settings are also available.