
A heatwave is defined as a period of 3 days when the HLI is well above the average conditions for your feedlot location. The severity of the heatwave is dependent on your location.
Kite determines a heatwave using the same methodology as the Australian Bureau of Meteorology, except Kite uses the HLI (BOM only looks at temperature) and is therefore more relevant to assessing the risk of cattle heat stress.
Heatwave Intensity (HWI)
The Heatwave Intensity (HWI) is calculated once per day. Unlike the HLI/AHLU model for determining your risk, it does not determine the risk for each cattle population. The Heatwave Intensity tells you what the environmental risks are, or in other words, how extreme the weather conditions are for your site compared to what is normal.
Therefore, you will need to review your HLI threshold calculator to determine which cattle are most at risk and then put measures in place to mitigate the risk well before the heatwave arrives.
Kite provides a 14 day outlook of heatwaves (and rain). The weather conditions that generally result in a heatwave are well forecast 7-10 days out, but the severity or exact day of the peak may vary as the event becomes nearer.
Events such as a rapid change in HLI or short acute events are not going to be picked up by the heatwave warning (which need to be extreme conditions for at least 3 days). Therefore we strongly encourage all sites use the heatwave forecast as an added layer of protection on top of the AHLU warnings.
Where can I find it?
The heatwave level is presented on the 14 Day Outlook dashboard. It is available to all subscription levels.
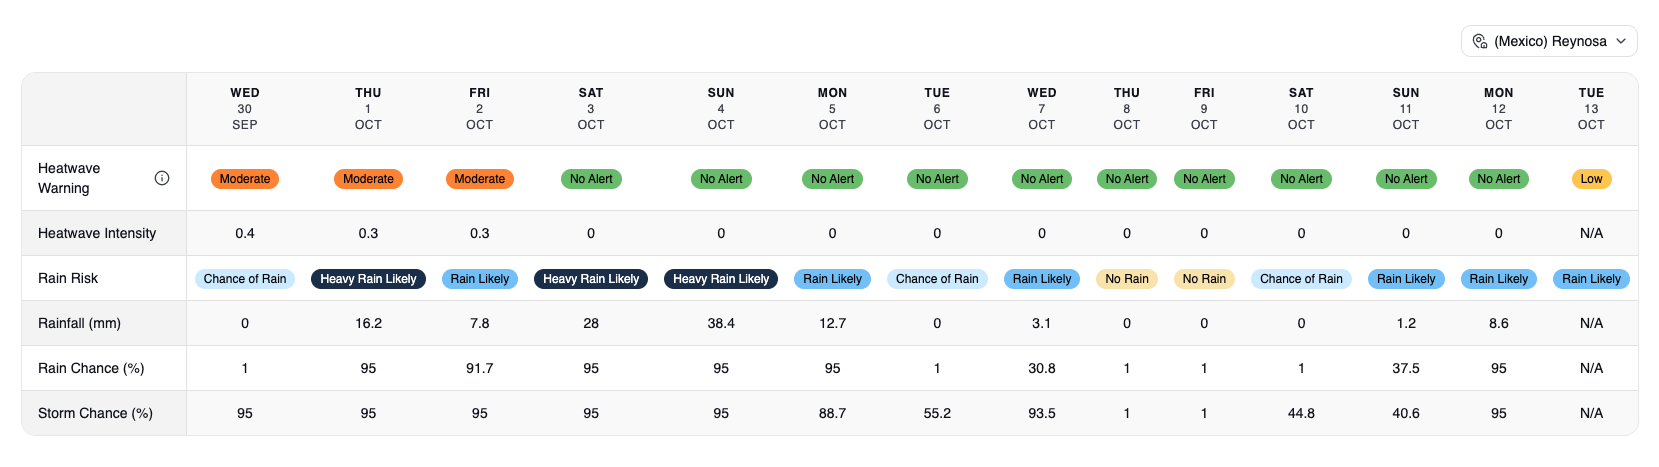
What does it mean?
The intensity level of a heatwave (HWI) is defined in the table below.
|
Heatwave Warning |
Heatwave Intensity (HWI) |
Description |
|---|---|---|
|
No Alert |
0 |
No heatwave present. |
|
Low |
0 - 0.25 |
Low-intensity heatwave identified that could represent the start or the end of a higher-intensity heatwave. |
|
Moderate |
0.25 - 1 |
Moderate intensity heatwave that may result in heat load in higher-risk animals. May also result in heat load if it is the first heatwave of the season or if pens are wet. |
|
High |
1 - 2 |
High level heatwave may result in heat load in high to medium-risk animals. |
|
Extreme |
> 2 |
Extreme heatwave. |
How can I interpret the heatwave warning to keep my cattle safe?
As this is a new indicator for everyone it will take some time to determine what intensity heatwave is important for your cattle and feedlot setup. Generally, for a standard animal acclimatised to the local conditions the moderate intensity heatwave corresponds with an AHLU>20, a high intensity heatwave is closer to 100 and an extreme intensity heatwave is >150.
This may vary across regions because the HWI is based on how hot the conditions are compared to your local climate.
How can I get email or SMS alerts for the heatwave warnings?
In Settings go to the Alerts tab, then:
For all subscription levels: Click on the subscribe button next to Heatwave Alert Email, and click Save. You will now receive an email when there is a Low, Moderate, High or Extreme heatwave forecast in the next seven days.
For Standard and Premium subscriptions only: Click on the subscribe button next to High Heatwave Alert SMS, and click Save. You will now receive an SMS message when there is a High or Extreme heatwave forecast in the next seven days.
How is the heatwave risk calculated?
-
First, the average of the current day and previous two days' HLIs is calculated. This is the recent average HLI, visualised below.
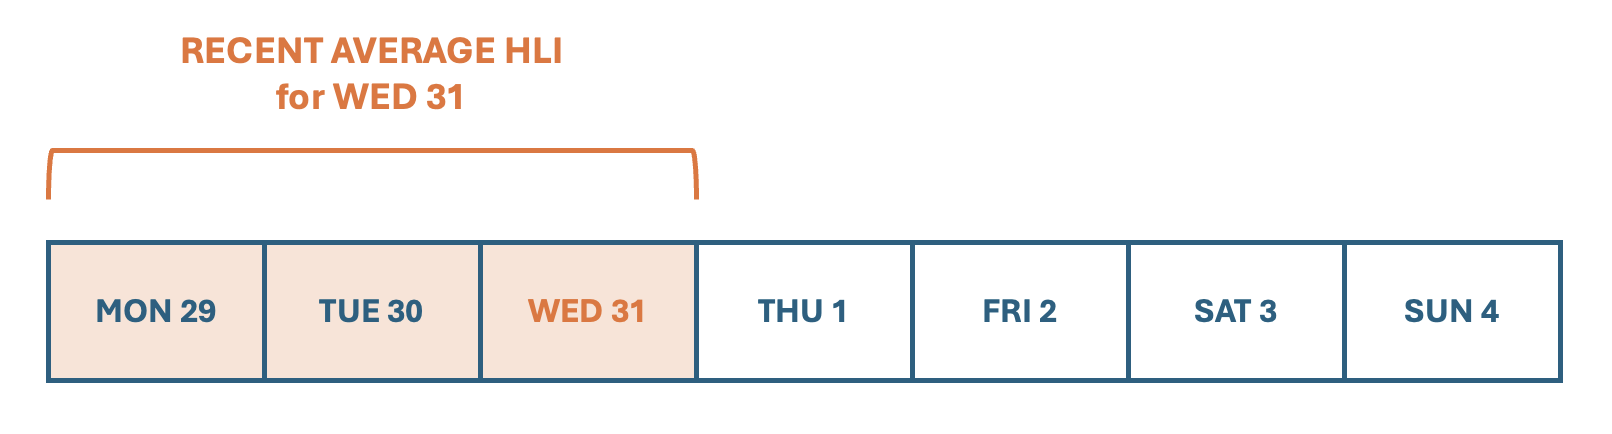
For example, if we’re trying to find the heatwave risk for Wed 31, the average HLI of Mon 29, Tue 30 and Wed 31 is calculated.
-
We calculate the significance, which shows whether the three-day period is unusually hot compared to historical values. This is done using the formula below. The minimum value enforced for this is 0.
Significance = Recent average HLI - 95th percentile HLI
The 95th percentile is an HLI where about 95% of historical values are lower than it, and only 5% are higher.
If the recent average HLI is 90 and the 95th percentile HLI is 88, then:
Significance = 90 - 88 = 2
-
The average of the past 30 days' HLIs is calculated. This is visualised below.
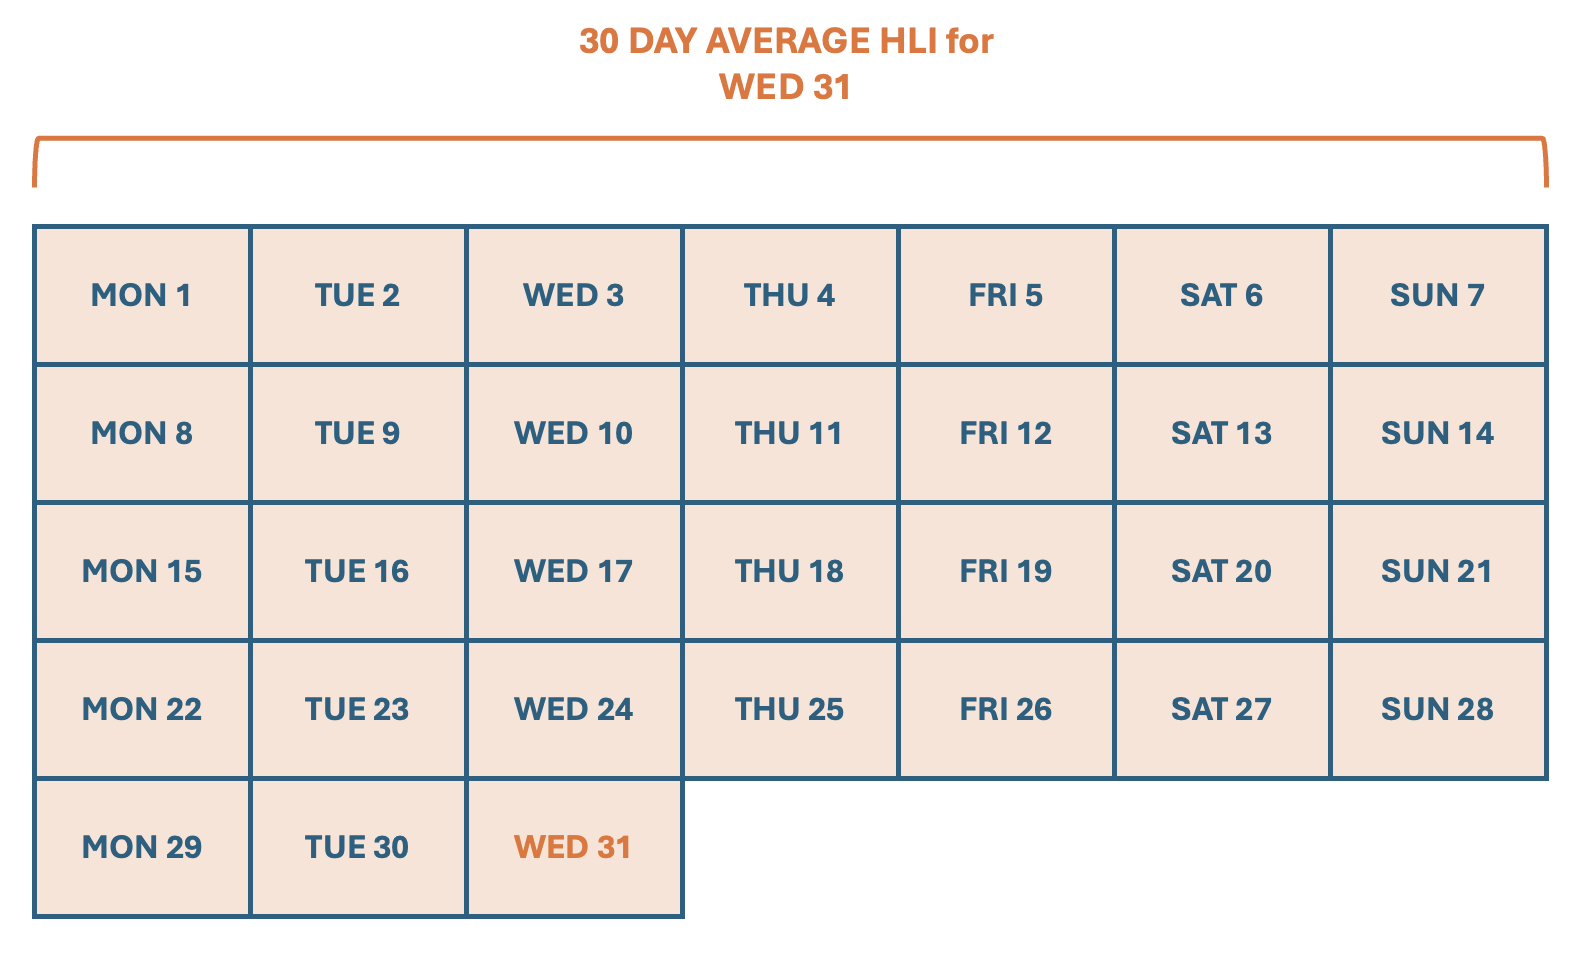
-
We determine the recent heat adjustment factor, which shows whether the recent three-day period is unusually hotter than preceding conditions. This is done using the formula below. The minimum value enforced for this is 1.
Recent heat adjustment factor = Recent average HLI - 30 day average HLI
If the recent average HLI is 90 and the 30-day average is 87, then:
Recent heat adjustment factor = 90 - 87 = 3
-
The EHF (Excess Heat Factor) is calculated as follows:
EHF = Significance x Recent heat adjustment factor
Following on from the earlier examples:
EHF = 2 x 3 = 6
-
The HWI (Heatwave Index) then scales EHF against historical severe heat events. It is calculated as follows:
HWI = EHF / 85th percentile EHF
The 85th percentile EHF is an EHF where about 85% of historical values are lower than it, and only 15% are higher.
If the 85th percentile EHF = 2, then using the earlier examples:
HWI = 6 / 2 = 3
-
To determine the Heatwave Warning level (i.e. low/moderate/high/extreme), the maximum HWI from the current day and future two days is found.
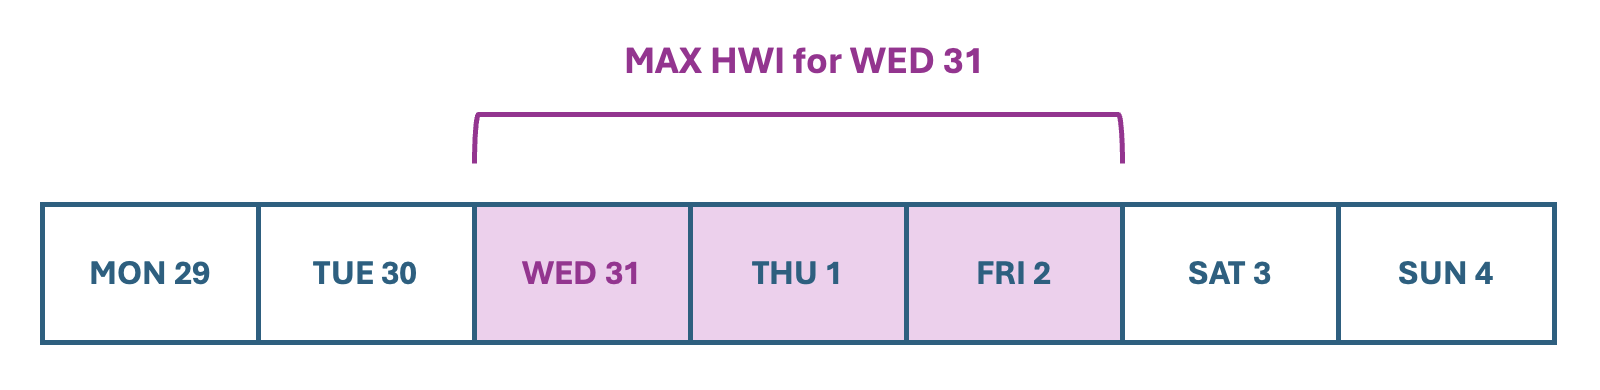
This value is then compared with the thresholds in the table above, to determine the current day’s Heatwave Warning.
This ensures that, as HWIs depend on the previous two days, if one of those previous days has elevated heat that will lead to a heatwave, this is reflected in this previous day’s warning level.
For example, if these are the daily HWI values:
|
|
WED 31 |
THU 1 |
FRI 2 |
SAT 3 |
SUN 4 |
|---|---|---|---|---|---|
|
HWI |
3 |
0.3 |
0.1 |
1.5 |
0.8 |
Using the thresholds defined in the table under the section What does it mean? some of the Heatwave Warning levels would be as follows:
|
|
WED 31 |
THU 1 |
FRI 2 |
|---|---|---|---|
|
Max HWI (over next 2 days) |
3 |
1.5 |
1.5 |
|
Heatwave Warning |
Extreme |
High |
High |