Kite’s Heat Risk Dashboard is designed to help sites minimise the risk of a heat-related illness. This is done via the hourly forecast of Apparent Temperature and a Heatwave Intensity level.
Apparent Temperature
The Apparent Temperature (AT) is an adjusted temperature, sometimes called the “feels like” temperature. It uses various combinations of temperature, relative humidity, wind speed and radiation to calculate an adjusted temperature, representing how the conditions feel more accurately than just the ambient temperature.
It should be considered a first-level screening tool to identify periods when additional preventative measures should be implemented or work rescheduled.
Heatwave Intensity
Kite’s daily heatwave forecast predicts not only temperature heatwaves but also heatwaves that are made more extreme by high relative humidity.
A heatwave is defined as a period of 3 days when the temperature or apparent temperature is well above the average conditions for your location. The severity of the heatwave is dependent on your location.
Because the heatwave intensity is based on the underlying principle that you are acclimatised to your location climate, additional measures should be considered for fly-in/fly-out workers for at least the first two weeks onsite.
It is also important to note that non-heatwave days can also have a heightened risk of a heat illness. Under conditions when the body has limited cooling capacity for any reason (such as no air movement or due to protective clothing), the body can overheat in under an hour with moderate activity. Therefore it is important to look at all risk factors to determine the risk of a heat illness. Kite’s Thermal Risk Assessment can do this for you.
Dashboard Features
-
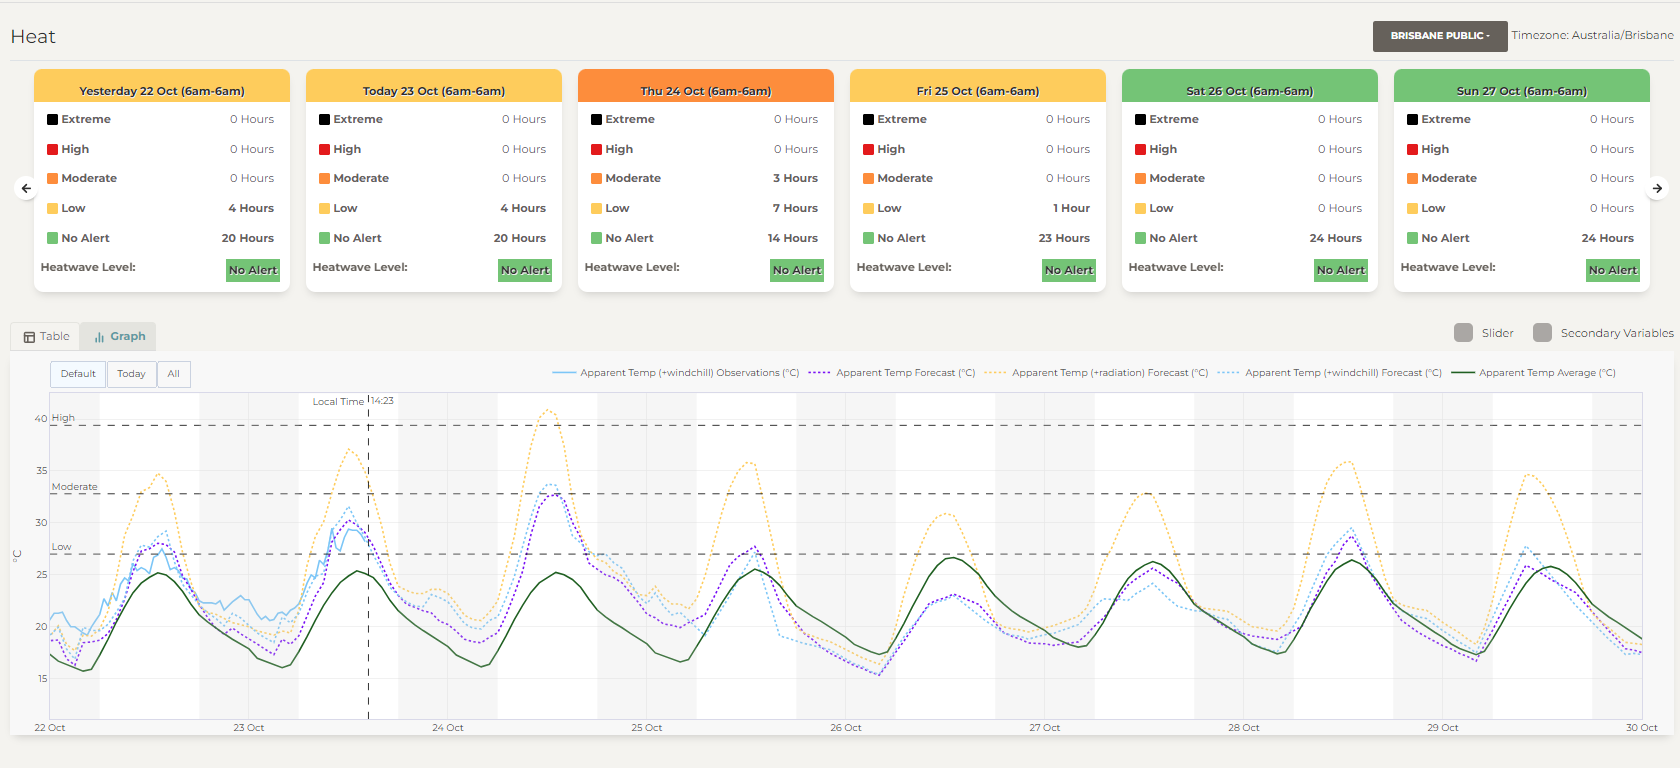
Cards showing daily:
-
Hours of Moderate, High and Extreme heat (based on AT)
-
Heatwave warning level (No Alert, Low, Moderate, High, Extreme)
-
Card colour based on risk level (maximum of either AT or HWI)
-
-
Daily cards are presented for today, the last 6 days and the next 6 days. You can navigate by using the arrows.
-
Note that a “day” is taken from 6 am to 6 am. For example, “today” is from 6 am today until 6 am tomorrow. This is to correspond to most shift operations. If your shift start times are different you can request a customised dashboard.
-
Detailed hourly data can be seen as a table (select Table tab) or graph (select Graph tab). The tabs are located above the table/graph on the left-hand side.
-
If you have your weather station set up to send data to Kite this is shown in the table in bold and is presented on the graph as a solid line.
-
You can extend the data viewed on the graph by clicking the All button, located in the top left-hand side of the graph window. Additional variables can be viewed on the graph by selecting the Secondary Variables check box (located above the graph on the right-hand side).
-
The table shows hourly variables (AT and wind speed) as well as coloured heat risk levels.
Risk Level Thresholds
A heatwave is defined by the amount of excess heat over a 3 day period. If the excess heat is above the top 5% (about the hottest 20 days per year) it is categorised as a heatwave. The intensity level of the heatwave (HWI) is defined in the table below.
The risk levels for the Apparent Temperature are adopted from OSHA (Directive CPL 03-00-024).
|
Alert level |
Heatwave Intensity (HWI) |
Apparent Temperature (AT) |
|
|---|---|---|---|
|
No alert |
0 |
< 27 |
Basic heat safety and planning. |
|
Low |
0 - 0.25 |
27 - 33 |
Basic heat safety and planning. |
|
Moderate |
0.25 - 1 |
33 - 39 |
Implement precautions and heighten awareness. |
|
High |
1 - 3 |
39 - 46 |
Implement additional precautions to protect workers. |
|
Extreme |
> 3 |
> 46 |
Consider the need to work or implement even more aggressive protective measures. |
FAQ: Which Apparent Temperature Should I Be Looking At?
Kite presents the forecast of the Apparent Temperature for a range of different situations. If you are working in an exposed location in the sun we recommend using the Apparent Temperature (+radiation) forecast. This is generally the highest AT and therefore indicates the highest risk.
The table below presents the different Apparent Temperatures used in Kite and which one to use in a specific situation.
|
Name |
Code |
Variables included |
Relevant situation |
|---|---|---|---|
|
Apparent Temp |
AT |
Temperature and humidity |
Shade and sheltered from the wind. |
|
Apparent Temp (+Wind Chill) |
AT - wc |
Temperature, humidity and wind |
Shade, not sheltered from the wind. |
|
Apparent Temp (+Radiation) |
AT - rad |
Temperature, humidity, wind and radiation |
Not sheltered from the wind or sun. |
|
Apparent Temp Average |
AT - avg |
Temperature and humidity |
Average conditions for the location and time of year. |
Apparent Temperature (temperature and humidity) is also known as the Heat Index.
The AT - rad includes all types of radiation such as radiation from the sun and from the ground. This is why the AT - rad can sometimes be higher than AT at night.