Once you have selected your animal factors and feedlot parameters in the RAP you will be given a summary of the risk for the HLI Threshold representing that cattle population (for both healthy and sick or recovering animals).
The Graphs and Tables
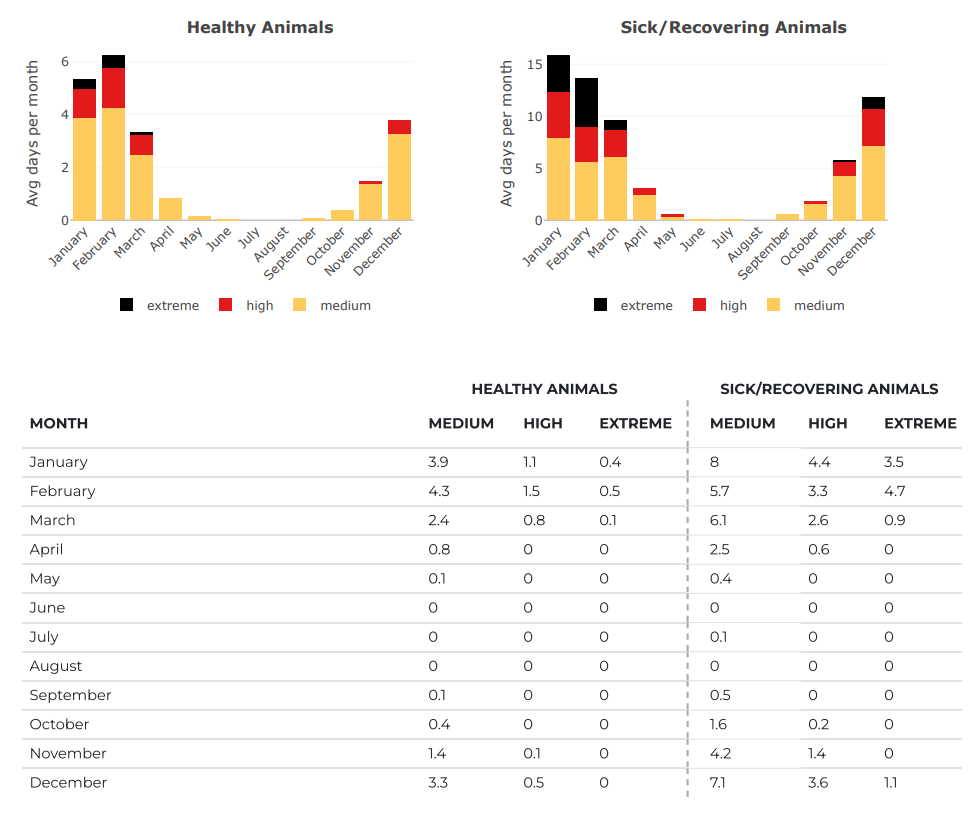
The data is presented graphically and in a table for your BASE risk scenario (i.e. no mitigation options or adjustment factors). The data tells you how many days (on average) each month you can expect to be moderate (AHLU 20-50 units), high (AHLU 51-100 units) and extreme (AHLU >100 units) risk.
Therefore to minimise the risk during these events a mitigation strategy should be determined in advance and documented in your heat load management plan. This can be done using the scenario options in the RAP.
The Summary of HLI Thresholds
The summary of HLI Thresholds presented in your RAP report can be used to document the mitigation options and identify periods of higher risk for this cattle population. It can also help determine how you want to monitor your risk.
The RAP will present HLI Thresholds within the range from 78 to 100 in 1 unit steps. We cannot forecast for all these AHLUs so instead we present six AHLU categories from 80 to 95. A table showing which AHLU category should be monitored for each HLI Threshold is available here.
