Rain Risk Dashboard
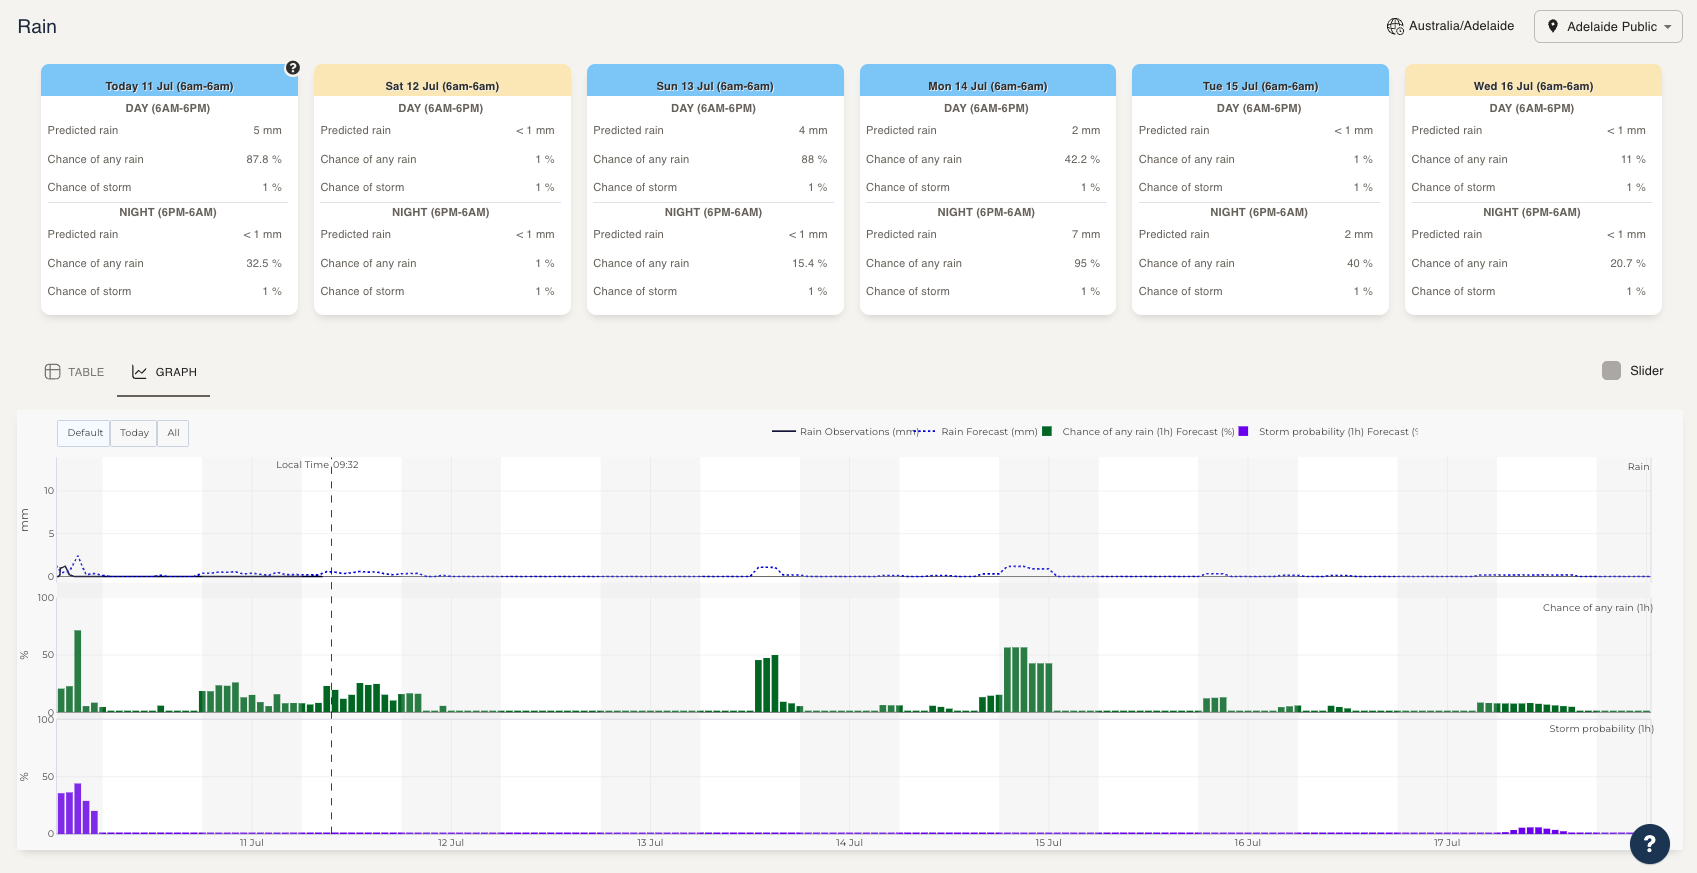
The Rain Risk Dashboard is designed to allow users to determine the risk of rain and storms for the next seven days.
Dashboard Features
Cards showing daily summaries and colour-identified risk levels for the next 6 days.
For sites with a weather station, a summary of historical rain observations is also presented.
Detailed hourly data can be seen as a table (select Table tab) or graph (select Graph tab). The tabs are located above the table/graph on the left-hand side.
If you have your weather station set up to send data to Kite this is shown in the table in bold and is presented on the graph as a solid line.
You can extend the data viewed on the graph by clicking the All button, located on the top left-hand side of the window.

Example Rain Risk Dashboard
Card Colours
The card colours represent the rain risk levels, which are defined as:
Chance of Rain (light blue) | If the probability of any rain or a thunderstorm is > 1%. |
Rain Likely (medium blue) | If the rain predicted is > 0.1 mm/hr or > 1 mm/day. |
Heavy Rain Likely (dark blue) | If the rain predicted is > 2 mm/hr or > 15 mm/day. |

These are the standard settings. Custom settings are also available.
