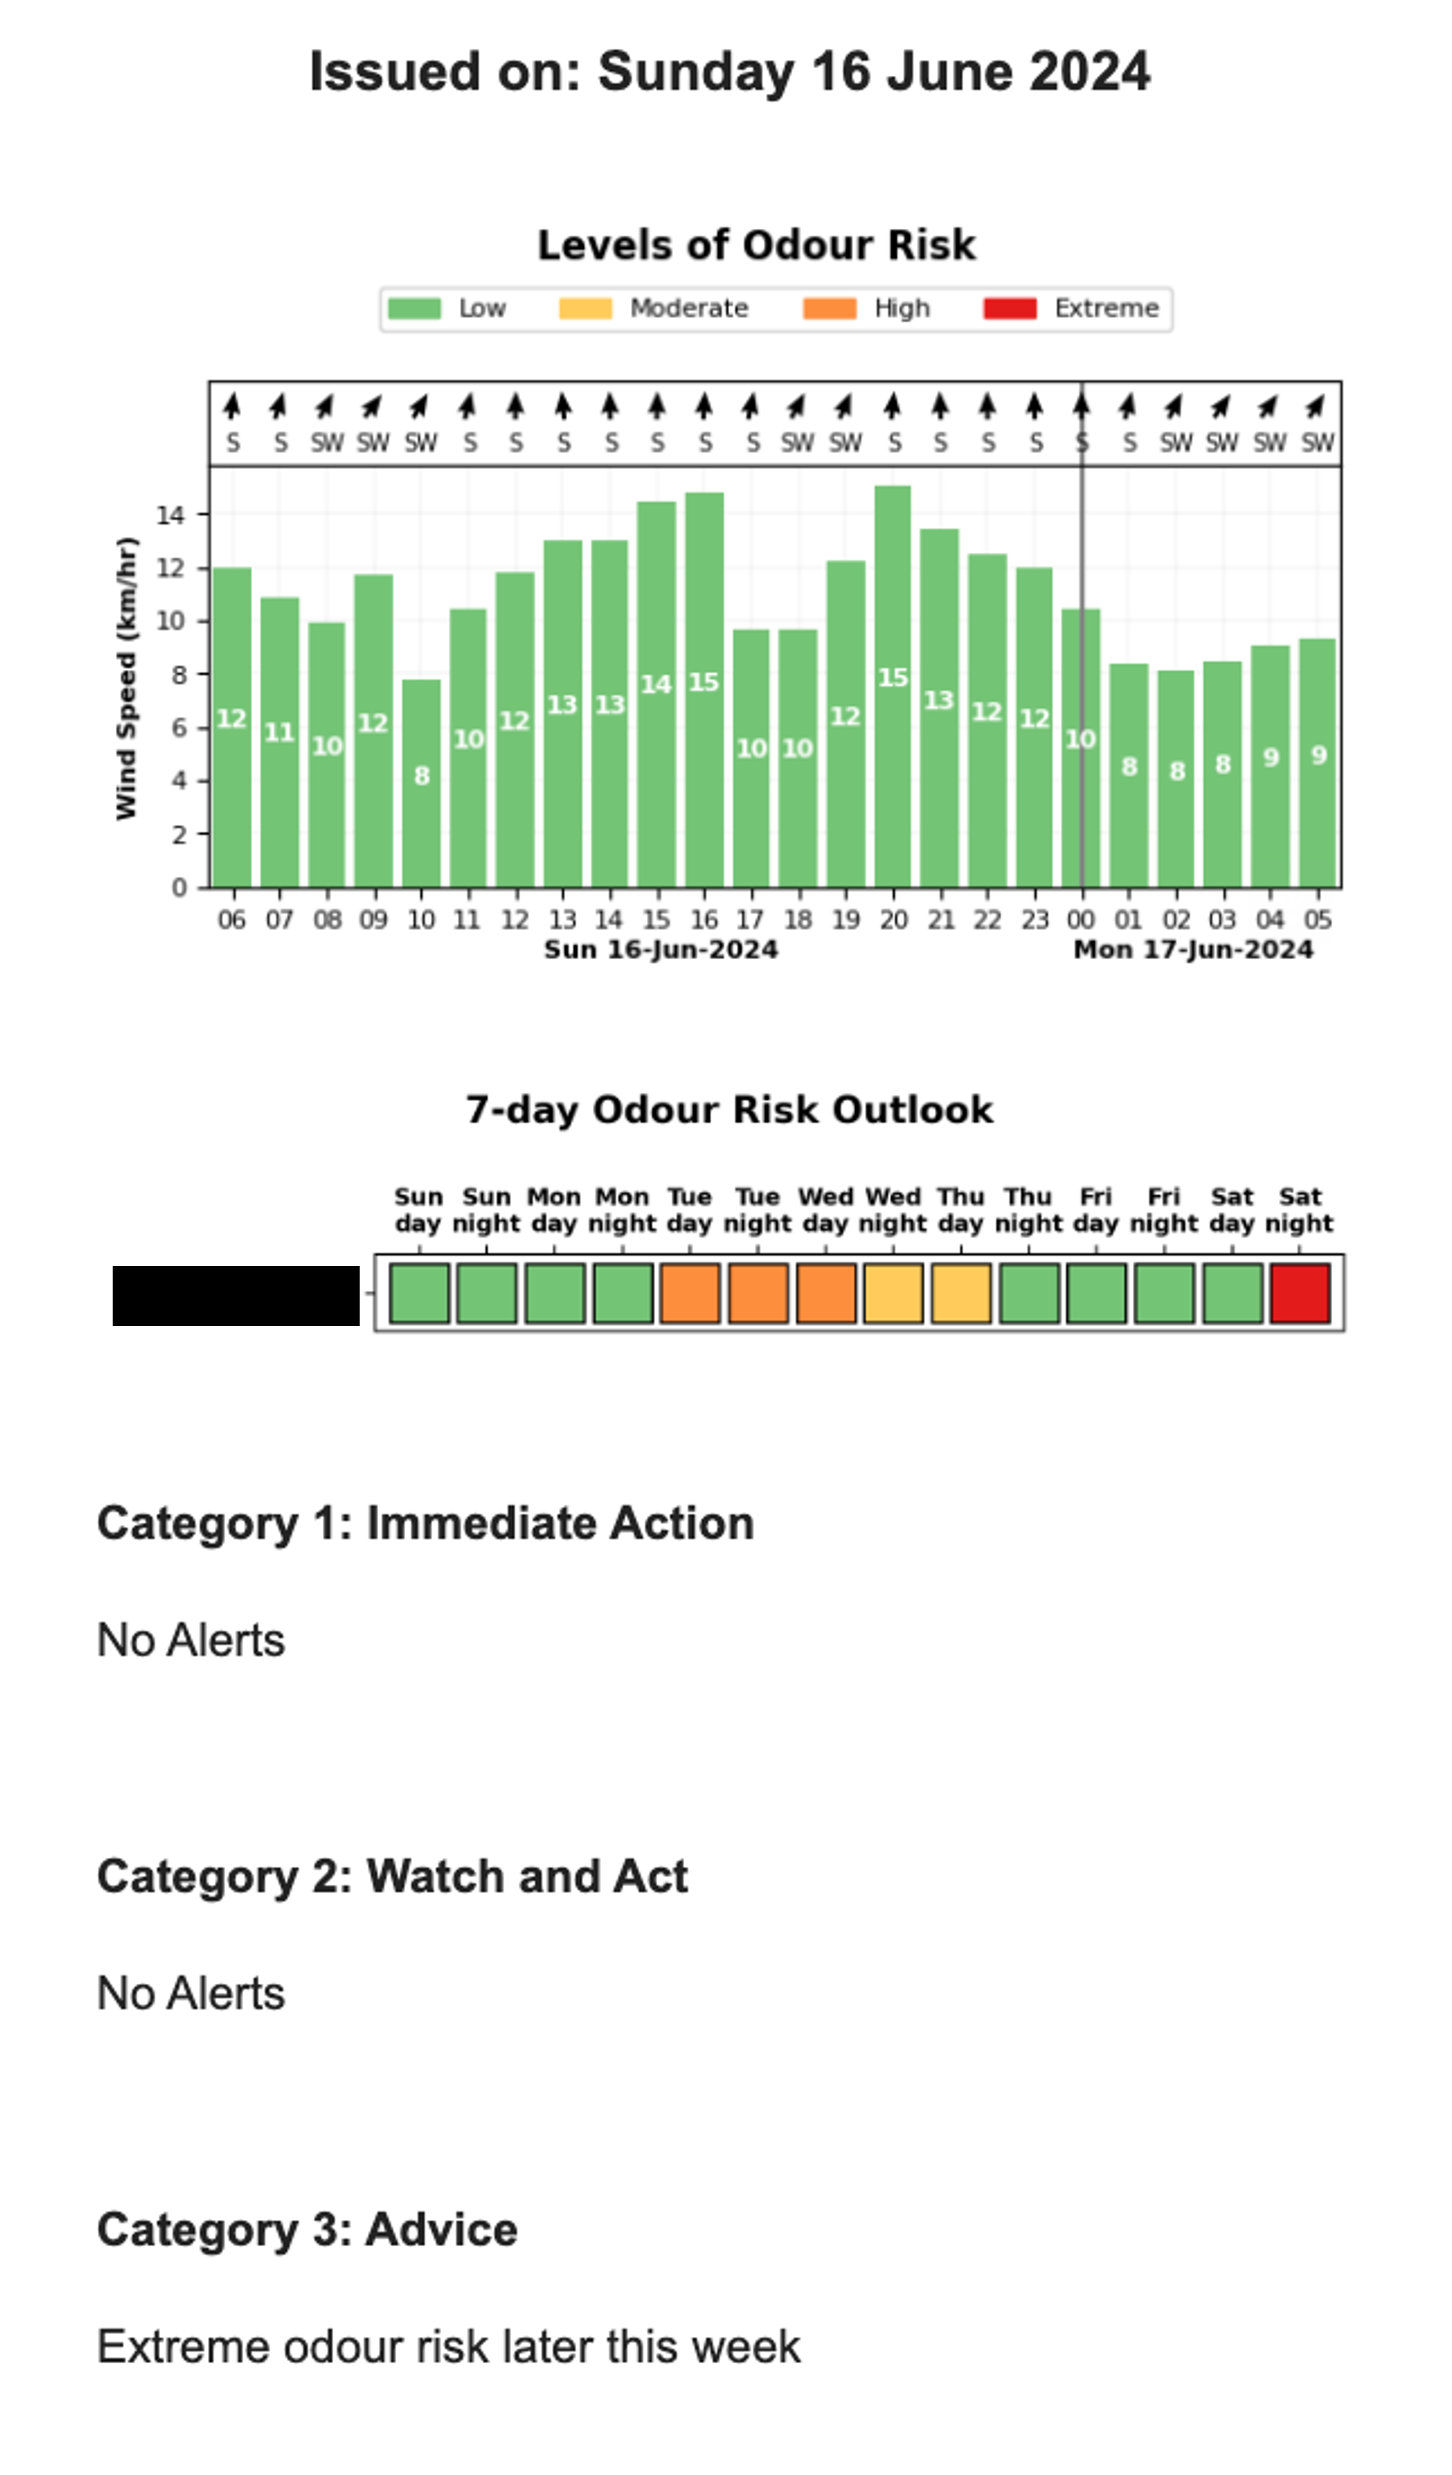
The Odour Toolbox Report (example below) presents a graph with hourly data for the current day, a 7-day odour risk outlook, and three categories of alerts.
The graph shows the forecasted wind speed for each hour for the upcoming day, with each column coloured by the odour risk level.
Wind direction is shown as arrows above the columns, and the affected sector is also considered in the colour of the columns. For example, if the wind direction does not impact a sector which is a cause for alert, the columns will remain green.
The 7-day odour risk outlook shows coloured squares with the forecasted odour risks for each day and night of the next week.
Three categories of alerts are listed under this forecast:
-
Immediate Action
-
Watch and Act
-
Advice
An SMS is sent to SMS subscribers with Immediate Action alerts if there are any.