Odour Risk Dashboard
Under certain environmental conditions, odour-generating activities have the potential to cause odour pollution that can result in complaints.
Kite’s Odour Risk Dashboard provides an hourly forecast of conditions 6 days ahead of odour propagating toward your sensitive receptors. This can help sites minimise the risk of odour causing a complaint through proactive odour reduction strategies.
Dashboard Features
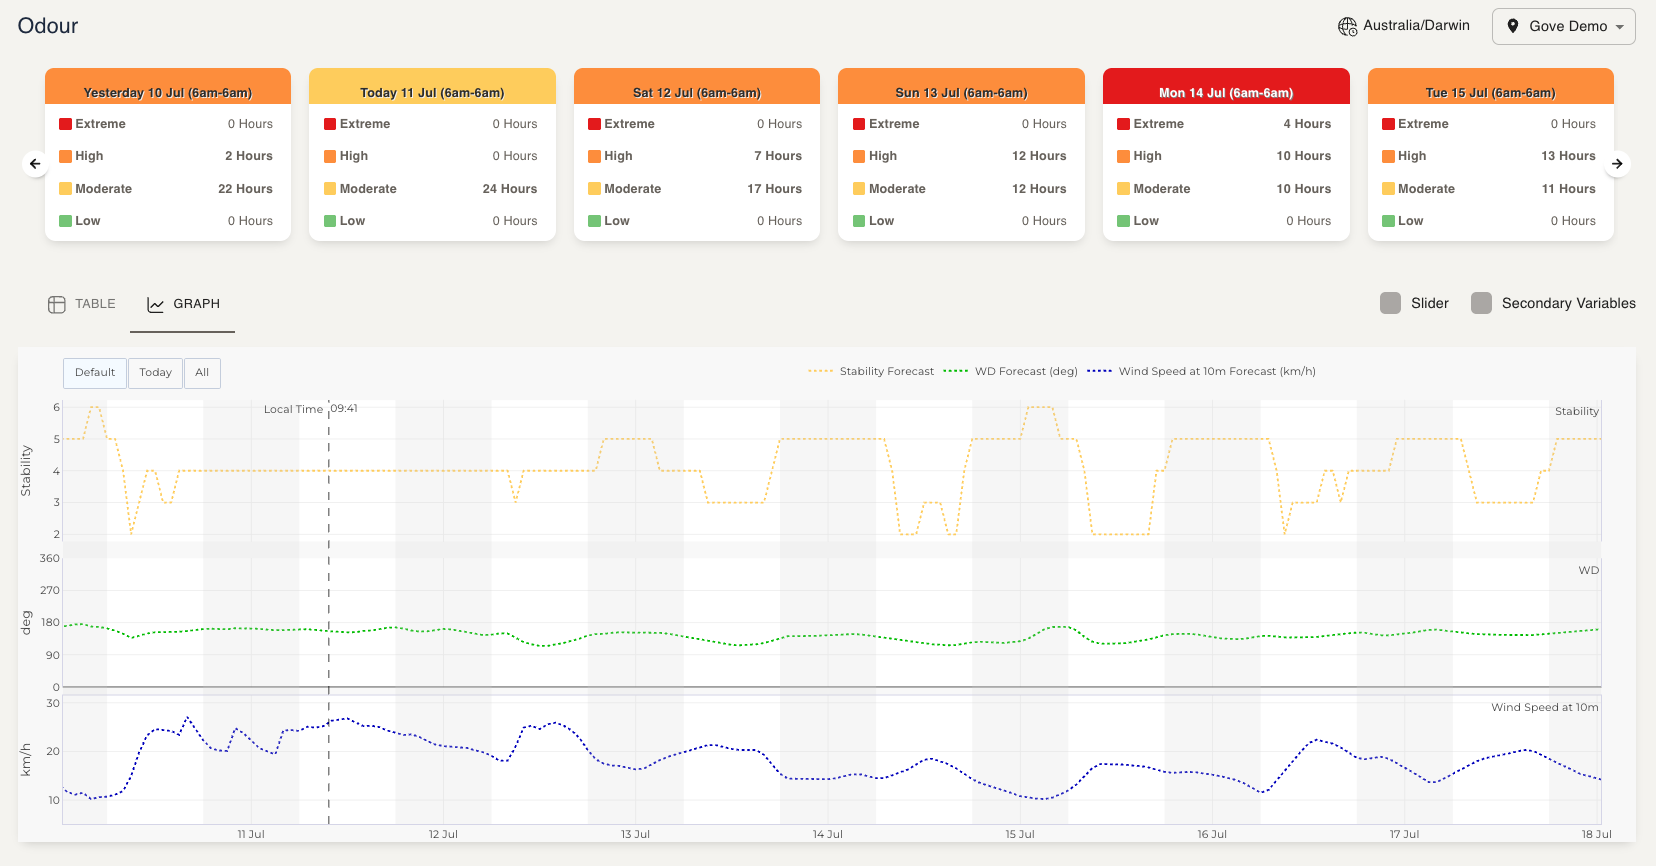
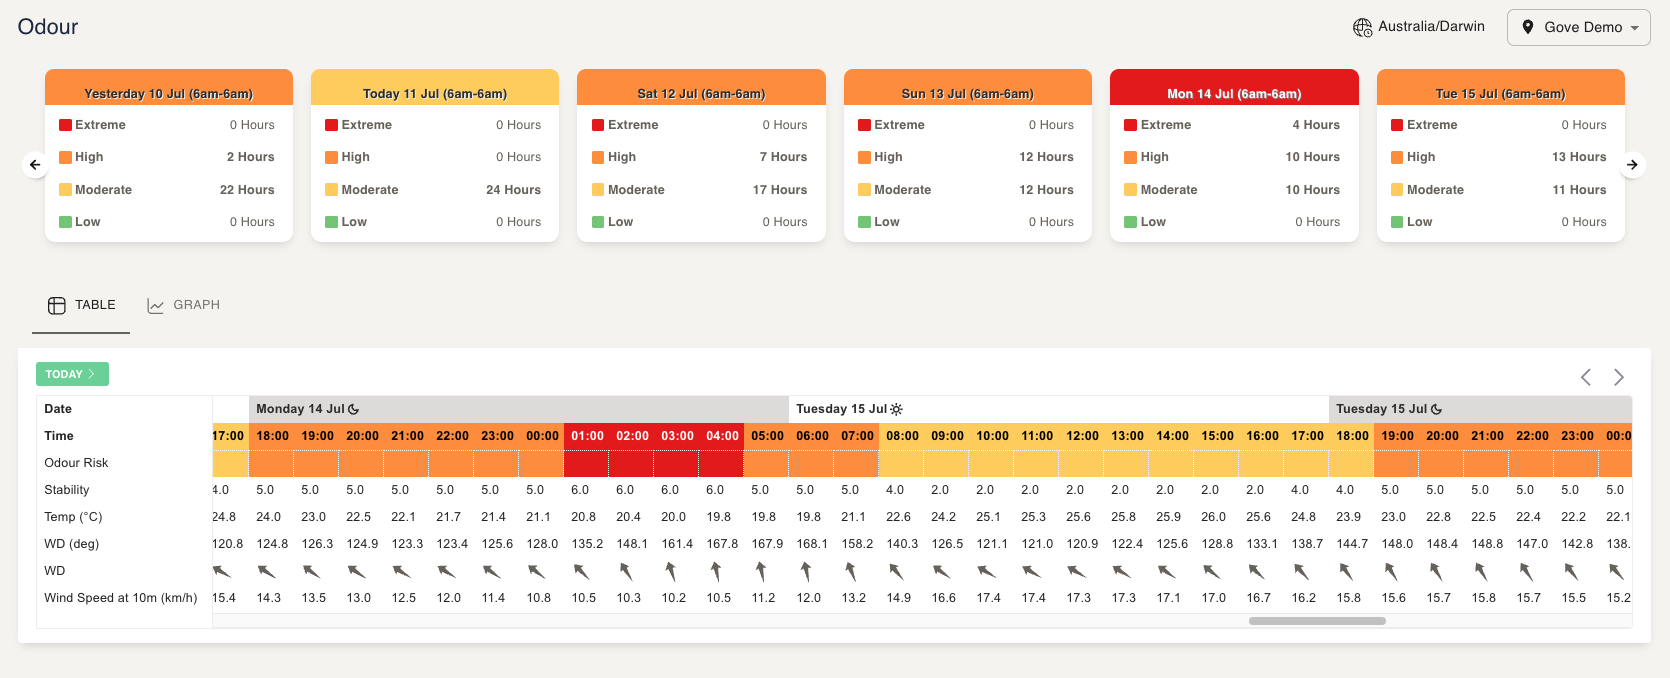
Cards showing daily summaries and colour-identified risk levels.
Cards are displayed for today, the last 6 days and the next 6 days.
Note that a “day” is taken from 6 am to 6 am. For example, “today” is from 6 am today until 6 am tomorrow. This is to correspond to most shift operations. If your shift start times are different you can request a customised dashboard.
Detailed hourly data can be seen as a table (select Table tab) or graph (select Graph tab). The tabs are located above the table/graph on the left-hand side.
If you have your weather station set up to send data to Kite this is shown in the table in bold and is presented on the graph as a solid line.
You can extend the data viewed on the graph by clicking the All button, located in the top left-hand side of the graph window. Additional variables can be viewed on the graph by selecting the Secondary Variables check box (located above the graph on the right-hand side).

Example Odour Risk Dashboard with Graph Display

Example Odour Risk Dashboard with Table Display
Odour risk levels and alert settings will depend on the nature of the odour source. For surface-based sources, the risk is higher under stable atmospheric conditions and light winds. For stack sources, the conditions that may cause higher risk are stronger winds and potentially unstable atmospheric conditions. The Kite team will work with you to determine the most suitable set of conditions for your alerts.
