Under certain environmental conditions such as thermal inversions and light wind speeds, noise can propagate for long distances. Noise-generating activities have the potential to cause noise pollution under these conditions.
Kite’s Noise Risk Dashboard provides an hourly forecast of conditions 6 days ahead of noise propagating toward your sensitive receptors.
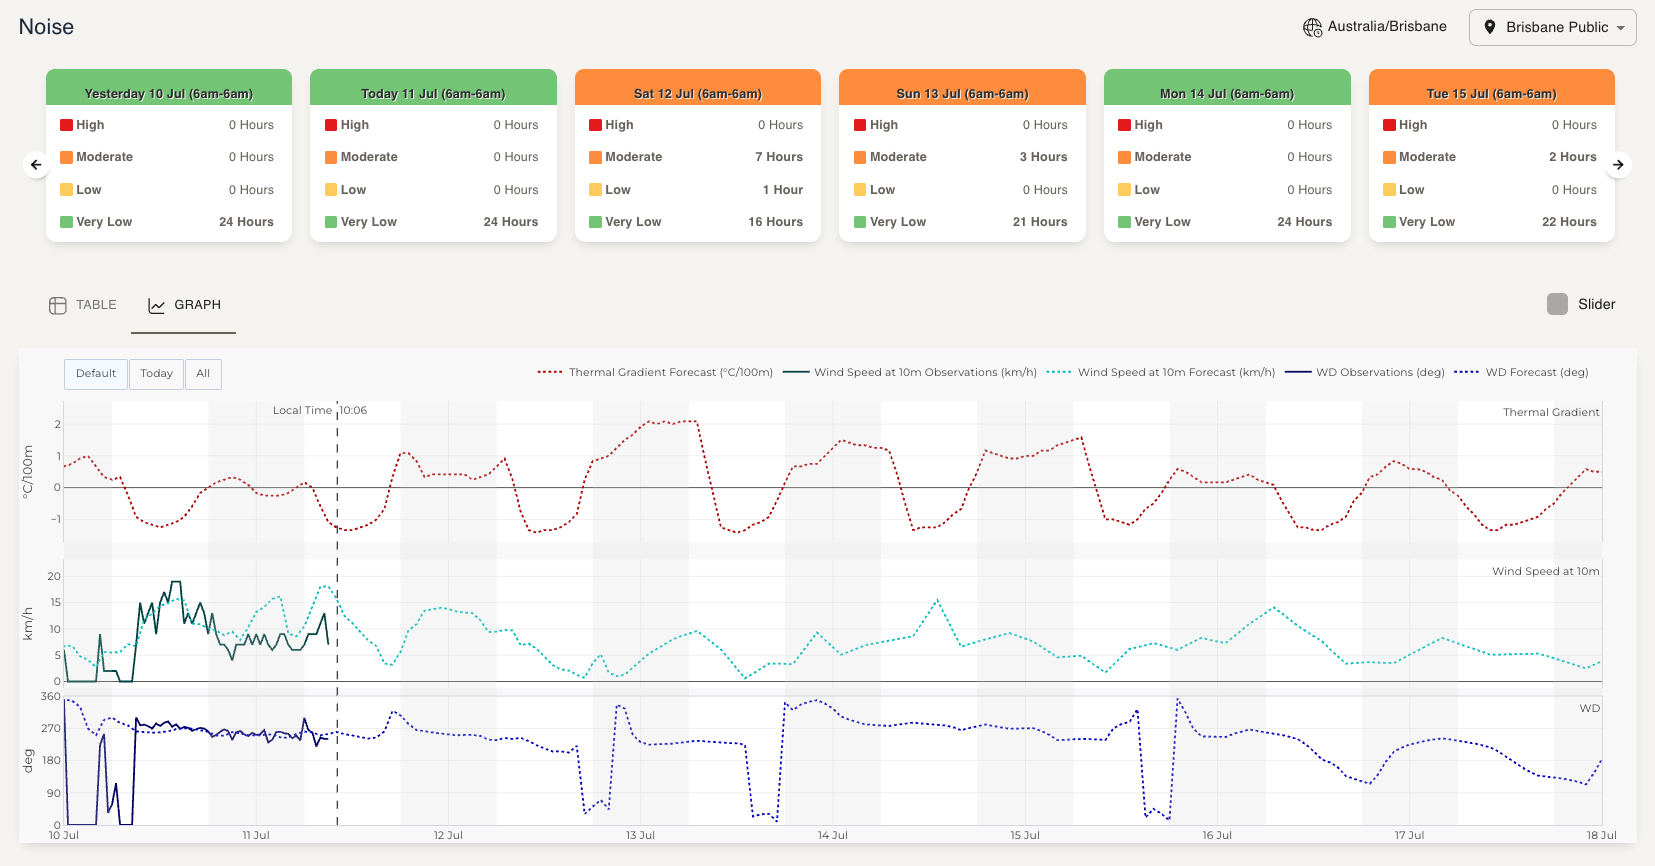
Dashboard Features
-
Cards showing daily summaries and colour-identified risk levels.
-
Cards are displayed for today, the last 6 days and the next 6 days.
-
Note that a “day” is taken from 6 am to 6 am. For example, “today” is from 6 am today until 6 am tomorrow. This is to correspond to most shift operations. If your shift start times are different you can request a customised dashboard.
-
Detailed hourly data can be seen as a table (select Table tab) or graph (select Graph tab). The tabs are located above the table/graph on the left-hand side.
-
If you have your weather station set up to send data to Kite this is shown in the table in bold and is presented on the graph as a solid line.
-
You can extend the data viewed on the graph by clicking on the All button, located in the top left-hand side of the graph window.
Risk Level Thresholds
Risk levels are set based on the following:
|
Wind Speed (m/s) |
Temperature Gradient (°C) |
||
|---|---|---|---|
|
<1.5 |
1.5 - 4 |
>4 |
|
|
<0.5 |
Very low |
Low |
Moderate |
|
0.5 - 3 |
Very low |
Moderate |
High |
|
>3 |
Very low |
Low |
Moderate |
Alerts can be configured to include the above risk levels as well as a specified wind sector.