Dust Risk Toolbox Report
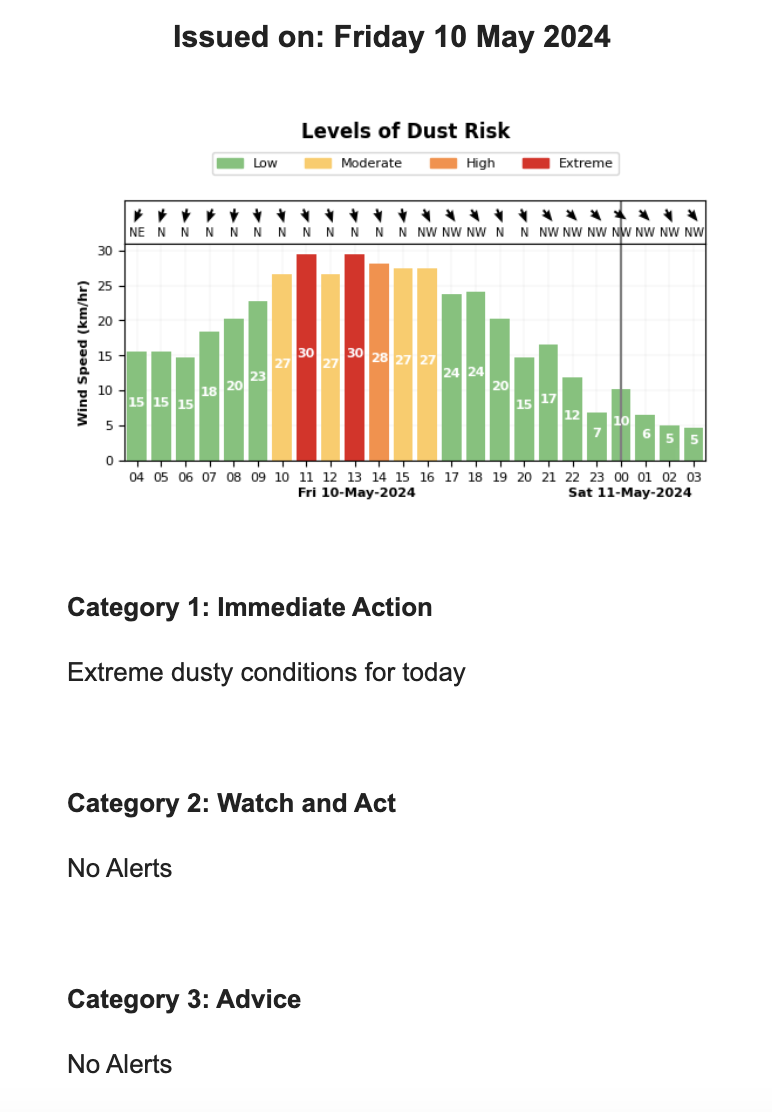
The Dust Toolbox Report (example below) consists of a graph and three categories of alerts.
The graph presents the forecasted wind speed for each hour for the upcoming day, with each column coloured by the dust liftoff index. This is split into levels according to configurable thresholds. The default threshold levels are:
0 - 50: Low
50 - 80: Moderate
80 - 100: High
100+: Extreme
Wind direction is shown as arrows above the columns, and the affected sector is also considered in the colour of the columns. For example, if the wind direction does not impact a sector which is a cause for alert, the columns will remain green despite the dust liftoff index.
This graph always covers the first 24 hours after 6am, but if an event is detected on the next day, a second figure showing the following 24 hours is also provided.
Three categories of alerts are listed below the graph/s:
Immediate Action
Watch and Act
Advice
An SMS is sent to SMS subscribers with Immediate Action alerts if there are any.

Example Dust Risk Toolbox Report
