Monthly Admin Report
The purpose of the Monthly Admin Report is to keep site admins informed about:
Who has access to their site (list of users)
Who is set up to receive notifications
What settings were changed in the last month
Forecast performance statistics (see explanation below)
A summary of the HLI climate for the month
How many alerts were generated for the month
The monthly report is generated in the first week of the month and presents the summary for the past month. It is available to admin users only, and contains the following sections:
Subscription Details
Current Subscription - This is the number and level of Kite subscriptions for the organisation
Subscription Status - active, cancelled, past_due
Billing email - This is the email account that will receive the subscription renewal invoices
If this address is incorrect please get in touch with us.
Users
The Users table presents the user names, email addresses and phone numbers for all users of the organisation. It also includes the permission levels.
This does not include external users (e.g. vets and nutritionists).
General Information for Each Feedlot
Location - This is the Latitude and Longitude of the feedlot and the location where the forecast is generated.
Current Monitored Risk Level - This is the AHLU category used to assess the general heat risk of the yard. This is also the level used to trigger the alerts.
AHLU Resets - A list of the time and user responsible for resetting the AHLU to zero.
Weather Station Configured - Indicates if your weather station is set up and feeding data to Kite (you will require a Premium Kite Subscription to access this feature).
Weather Station Provider - The company responsible for maintaining your weather station.
Alert
This indicates the number of alerts generated by the system and received by the users who are subscribed to the notifications (see User Notifications information below).
The observation alerts are only available to customers who have their weather stations integrated with Kite (Premium Subscriptions). For non-premium subscriptions the number of obs alerts generated will be zero.
User Notifications
This table presents a list of all reports and alerts that each user is subscribed to.
You will require a Premium Subscription to receive alerts from your weather station even if you have selected that notification.
If multiple feedlots are included in the report the list is presented per feedlot.
Climate Summary
HLI Climate Average - This presents the average HLI for the month based on the 30-year climatology for the site.
This is the data that is used to generate the frequency of events in your RAP, and which is also displayed on the dashboard graphs as a dark green line.
HLI Observed Average - This presents the average HLI for the month calculated from your weather station data. If we do not receive your weather station data this will not be displayed.
HLI Forecast Average - This presents the average HLI for the month calculated from the forecast (today’s forecast). If we do not receive your weather station data this will not be displayed.
For sites without weather stations only the HLI Climate Average is presented.
Forecast Performance - Only Available for Premium Customers
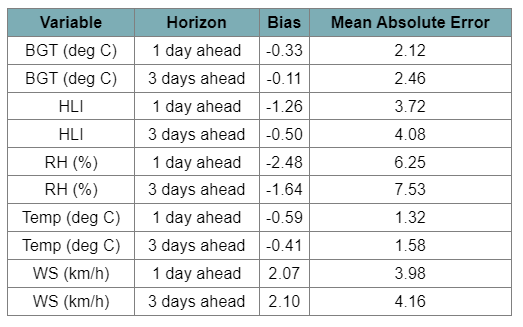
For each site, we compare the forecast to your weather station data. We look at the forecast horizons of 1 day ahead (ie. today's forecast) and 3 days ahead (i.e. not tomorrow, but the next day).
A general measure of forecast performance is called the Mean Absolute Error (MEA). It is the mean or average of all the errors across the period. For example in the table below the MAE for 1 day ahead HLI is 3.72. This means that on average, the HLI is 3.72 units different from the site's observed HLI.
The MAE is useful but does not tell you if the forecast is likely to over or underestimate the HLI. To understand this you need to look at the Bias.
Bias represents the historical average error. Are the forecasts, on average, too high (i.e., the tendency is to overpredict) or too low (i.e., the tendency is to underpredict)? This therefore gives the overall direction of the error. In the example below the HLI is on average underpredicted by 1.26 units one day ahead.

