It is common practice to understand the weather conditions ahead by comparing them to the climatological average. This is commonly presented on the news and looks a bit like this:
“The temperature for today is predicted to be 35°C, five degrees above average for this time of year”
So what is the climatological average and how can it be calculated for the HLI?
Kite’s climatological average is the average conditions for the time of year based on at least 30 years of data. It can be presented as the average maximum for a day, average minimum or daily average.
The data set we have developed for the Risk Assessment Process (RAP) allows us to determine the climatic average conditions for each feedlot location. We have calculated the HLI for every hour of the day for all feedlot locations for a 30-year period. That's over a quarter of a million data points for each site!
The data has been analysed to determine an HLI climate profile for each site.
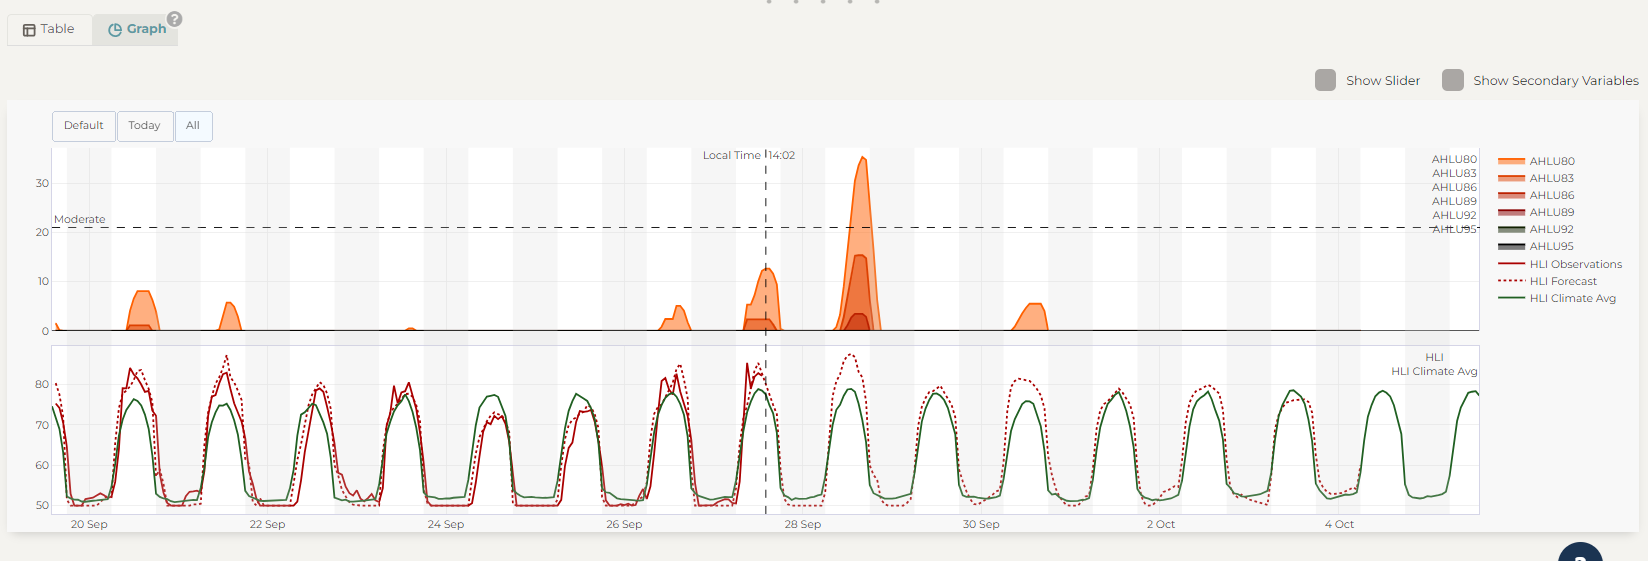
For now, you can view the HLI climate average by selecting the Graph option on the Cattle Heat Risk Dashboard. The HLI climate average is shown on the HLI graph in green.
The solid red line is the observations from the weather station and the red dotted line is the forecast.
Why do I want to know?
Knowing how the HLI is predicted to vary compared to the long-term average can help you understand your risk. It tells you how much the HLI forecast is above or below average for that time of year.
This can be helpful to identify periods of higher risk (i.e. HLI above average, or very much above average). For example, the early start to the heat across much of Eastern Australia in September 2023 saw the HLI 10-20 units above the long-term average.
There is a silver lining to an early start to the hot weather, as the cattle will be more acclimatised to the heat before the summer!
As you know the HLI alone can’t tell you what your heat load risk is - you need to look at the AHLU for that. However, it does let you know if the environmental heat loading is higher than average.